Analytics
“Analytics” shows the results of displays and visitor actions in the selected project. Opening it requires “View” permission for “Analytics”.
Period and overview
In “Period”, choose “Last 7 days”, “Last 30 days”, “Last 90 days”, or “Custom period”. For a custom period, enter dates in “From” and “To”. The “Compare with previous period” checkbox compares the selected period with the immediately preceding period of the same length.
Both dates are included in the period in UTC. Reach includes users who saw the content or started a tour on those dates. Their subsequent engagement and completions are counted up to the time the report is calculated, including after the end of the period. Results for a past period can therefore increase. When comparing periods, both use data as of the same calculation time.
The period, dates, and comparison setting are saved in the report link. When you reopen the link or navigate back or forward, they take precedence over the project's saved period.
For example, select “Last 30 days” and leave “Compare with previous period” enabled. “Overview” shows the current values and a comparison with the preceding 30 days.
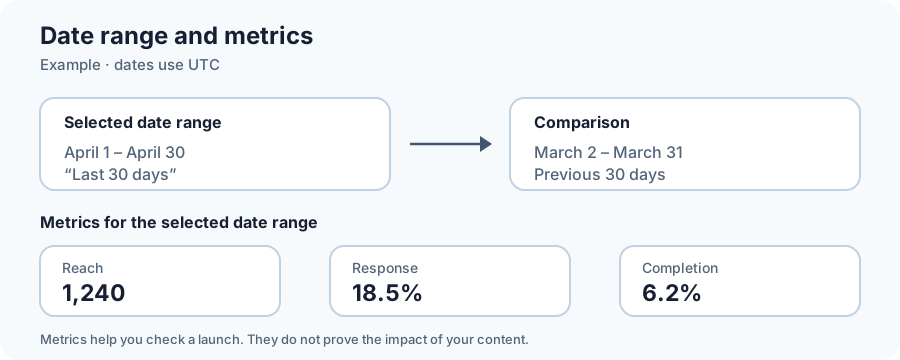
The example numbers show how to read the period and metrics. They do not demonstrate the content's impact.
The “Overview” tab shows:
- “Reach” — unique visitors who were shown content or started a tour;
- “Engagement” — visitors who interacted with the content, and their share of reach;
- “Completion” — visitors who completed a supported content item, and their share of reach.
Below are “Trend” and “Top content”. The “Content” tab includes updates, popups, tours, hints, checklists, and feedback. Filter the list by name, “Content type”, and “Status”. Open a content row to see its funnel, breakdowns by “Pages”, “Devices”, and “Elements”, and details for that format.
The funnel shows how many users from the selected group of displays or starts reached each stage, including tour steps after the end of the period. Each user is counted once at each stage. Progress from the previous stage and drop-offs relate to that same group.
In “Trend”, late engagement is attributed to the day the content was displayed or the tour started. Breakdowns use the page, device, and element at the time of the display or start. For example, if a user started a tour on page A and completed it on page B, the completion appears in the row for A.
For a tour, actions are linked to a recorded start with the same user, tour, version, and attempt number. Recording the same start again does not create a new attempt. Older events without an attempt number are not combined into attempts; the original data is not changed.
Dismissals, technical errors, and total event counts use the dates of the events themselves. The same applies to update and hint open/click details, popup frequency and outcomes, checklist items, and form responses. Tour step views and completions belong to the selected group of starts; technical step errors remain in the period of the events themselves.
Metrics help you choose content to investigate; they do not prove that the content caused visitor behavior.
If there is no data or an error occurs
If you see “Nothing found”, change the period or filters. For “Could not load analytics”, click “Retry” and check your “View” permission for “Analytics”. If metrics do not appear, make sure the widget is installed, “Collect visitor data” is enabled in Integration, and the selected “When to collect data” mode allows collection for the visitor.
Related articles
- Events — check custom events.
- Audience — check collected visitors.
- Integration — configure data collection.
- Troubleshooting — if data does not load.